Number of recent Covid-19 cases where you live in Richmond
By The Editor 31st Oct 2020


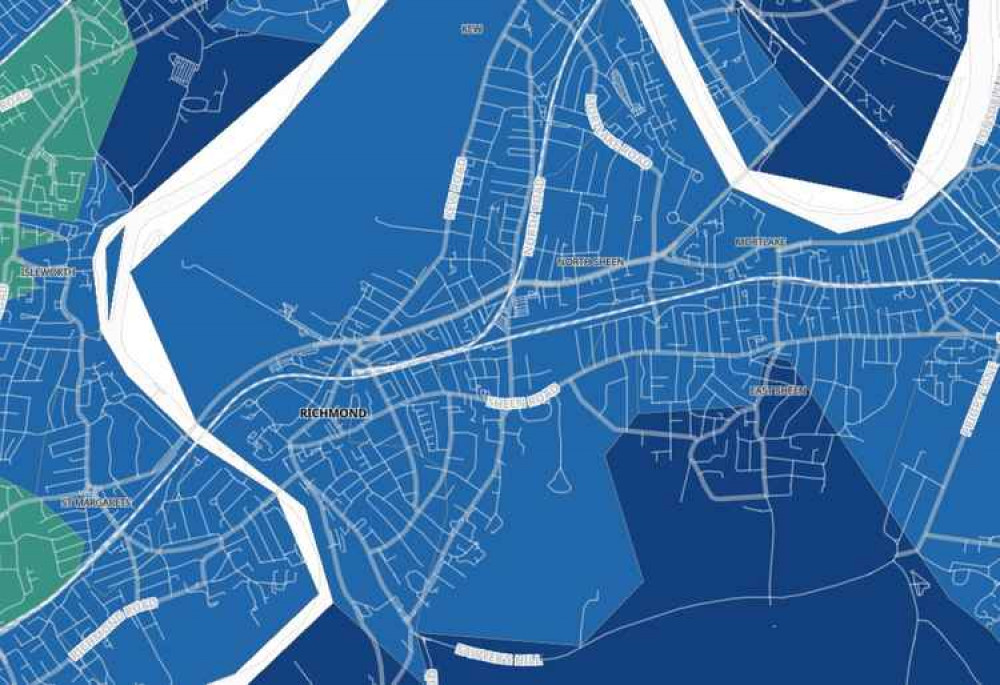
This heat map shows exactly where in Richmond is seeing the most coronavirus cases.
The government's new interactive map allows residents to see the seven-day rolling rate of new coronavirus cases broken down by Middle layer Super Output Areas (MSOAs).
These are small areas with an average population of 7,200 people living in them.
Dark purple and blue show the worst hit areas, while green and yellow highlight areas with lower rates.
In the seven days to October 24, this is how many cases there have been and each area's infection rate from lowest to highest.
Read next: Self-isolation failures behind a rise in coronavirus, Richmond Council leader says
Richmond Central - infection rate of 109 cases per 100,000 people (8 cases)
Queen's Road - 135 cases per 100,000 people (9 cases)Marble Hill - 136 cases per 100,000 people (9 cases)
East Sheen North - 153 cases per 100,000 people (14 cases)
North Sheen - 163 cases per 100,000 people (20 cases)Kew Gardens - 198 cases per 100,000 people (20 cases)
Richmond Park, Sheen Gate and Petersham - 222 cases per 100,000 people (16 cases)Ham - 236 cases per 100,000 people (13 cases)
The data shows that of all nearby areas, Hammersmith is currently seeing the biggest spike in Covid-19 infections.
Please like and follow our online newspaper on your favourite social media channel. You can find us @RichmondNubNews on Facebook, Instagram, LinkedIn and Twitter.
CHECK OUT OUR Jobs Section HERE!
richmond vacancies updated hourly!
Click here to see more: richmond jobs
Share:


