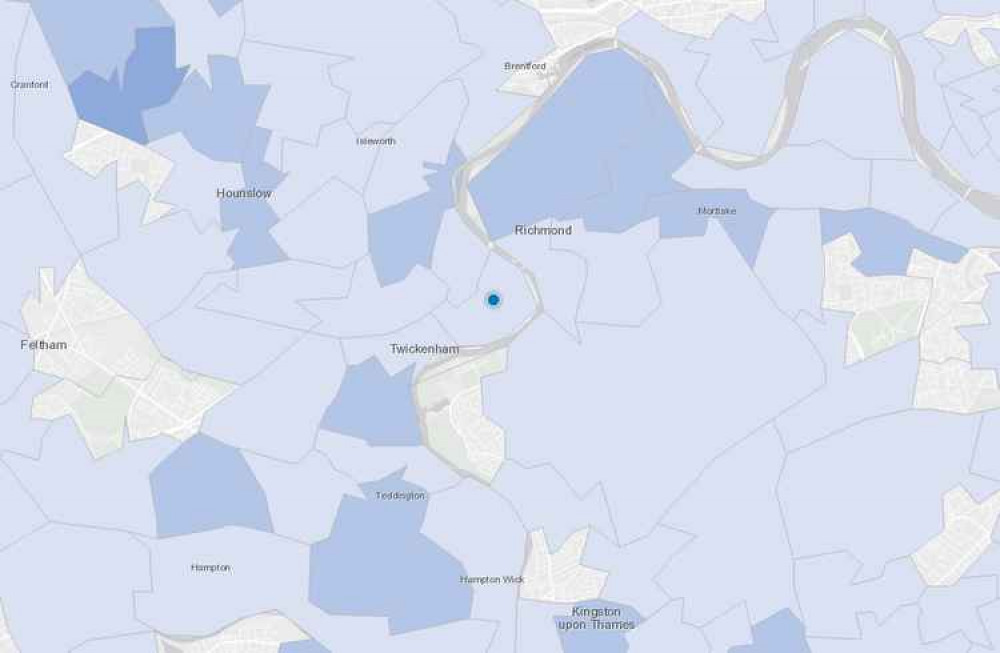
Heat map shows Richmond neighbourhoods with most Covid-19 cases
By The Editor 8th Oct 2020


This map shows the number of new Covid-19 cases in each neighbourhood where you live.
The spread of the virus in Richmond borough has increased sharply with 243 new positive tests in the last ten days.
This means nearly a quarter of our total number of cases (1054) have come in this recent period.
ArcGIS displays the latest coronavirus figures on a heat map of the UK to show which areas are seeing a spike in infections. Each area, known as a Middle Super Output Area, has an average population of 7,200.
In the week from September 27 and October 3, this is how many residents tested positive.
East Sheen North: 14 positive tests
North Sheen: 13Kew Gardens: 11
Strawberry Hill: 11Queen's Road: 7
Marble Hill: 7
Richmond Central: 6Mortlake and South Barnes: 6
Tudor Drive: 6St Margarets: 4
Ham: 0-2Latest covid coverage
Richmond records 208 positive covid tests in last ten days'Pack it in': Praise for our council leader's blunt message to covid rule breakers
Richmond now has capital's third highest covid infection rate after huge rise in casesSt Mary's University staff test positive for coronavirus
'Help us avoid a local lockdown': Special update for Richmond residentsWhat does the new NHS COVID-19 app do?
Twickenham testing centre to remain open as fans frozen out of rugby games
CHECK OUT OUR Jobs Section HERE!
richmond vacancies updated hourly!
Click here to see more: richmond jobs
Share:


