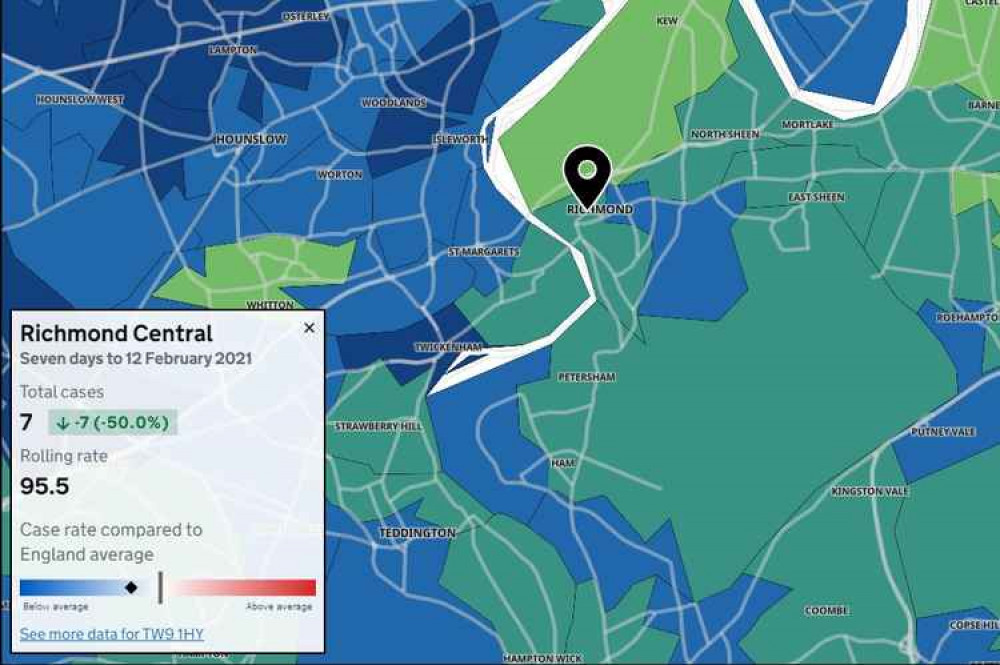
Heat map shows huge falls in covid cases across Richmond
By The Editor 18th Feb 2021


The number of new Covid-19 cases has fallen by more than half in a week in Richmond.
There were 178 new cases in the seven days to February 12 - a 54.7% decrease on the previous week.
By comparison, at the turn of the New Year, around 200 Richmond residents were testing positive for the coronavirus every day.
Our borough's infection rate has been steadily falling since then.
The government website plots latest infection rates and numbers of new cases in each neighbourhood in Richmond on an interactive heat map.
Take a look to see exactly how many cases have recently been confirmed where you live.
Please sign up for our weekly newsletter at the top of this story and follow our online newspaper on your favourite social media channel. You can find us @RichmondNubNews on Facebook, Instagram, LinkedIn and Twitter.
CHECK OUT OUR Jobs Section HERE!
richmond vacancies updated hourly!
Click here to see more: richmond jobs
Share:


