Official number of Covid-19 deaths in every part of Richmond borough
By The Editor 27th Jul 2020


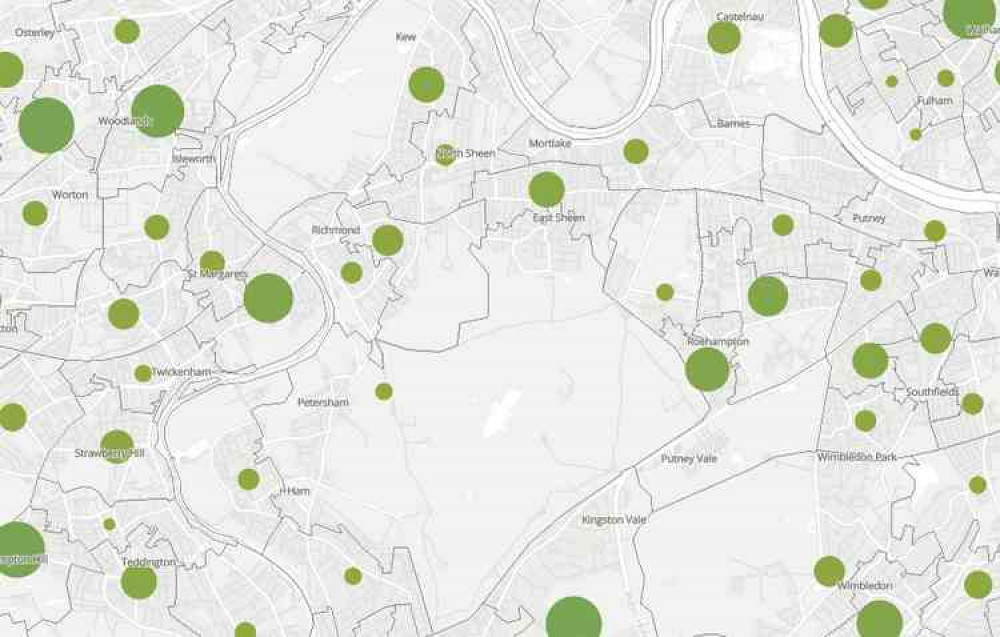
Official figures projected onto an interactive map show the number of deaths from Covid-19 in every neighbourhood around Richmond.
They were released by the Office for National Statistics and cover March-June of the pandemic.
Each area is defined as a 'middle layer super output area' of similar population size. So, for example, the area covering Richmond Park is considerably larger in geographical terms because so few people live in the actual park.
The figures show that one of the local areas with the highest number of coronavirus deaths is 'Twickenham Marble Hill', with 15.
They includes cases where "Covid-19 was the underlying cause or was mentioned on the death certificate as a contributory factor".
More Covid-19 coverage[.h2] A very personal tale of covid's impact on Richmond councillor Andree Frieze's family
Richmond director of public health: Covid-19 cases 'really low'[.b]
On the interactive map, the size of the circle is proportional to the number of deaths in each area. April was the month with the highest death toll due to the virus.
In Richmond Central, there were three deaths over the four months. In St Margarets there were four - all in April.
There have been eight in Kew, six in Queen's Road, eight in East Sheen North and two in Richmond Park, Sheen Gate and Petersham.
You can look at the figures on the Official for National Statistics website here.
The next update from the ONS follows in September to cover deaths from coronavirus in July.
Find us on social media
[H3]Join the conversation on our Facebook page
CHECK OUT OUR Jobs Section HERE!
richmond vacancies updated hourly!
Click here to see more: richmond jobs
Share:


