Top of the class! – Richmond schools lead national league tables
By Nub News Reporter 23rd Mar 2023


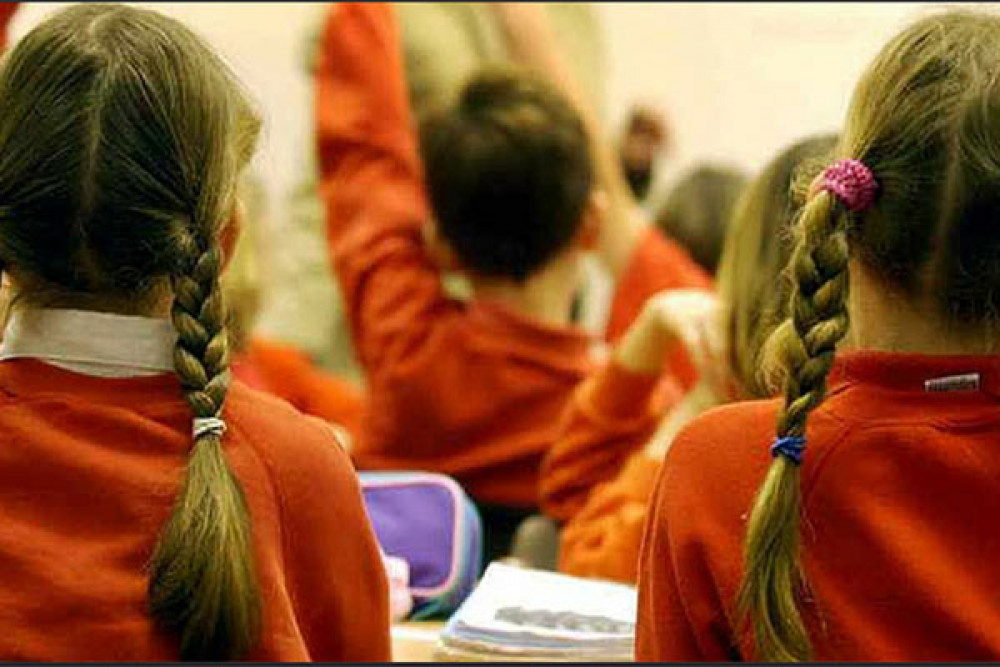
The borough's primary schools and children continue to lead the country in terms of education and progress.
Official data prepared for Richmond Borough Council's education committee also paint a positive picture for state Secondary schools, despite the problems of Covid, lockdowns and remote learning.
The figures for the 2021-2022 academic year are the first to include the outcome of tests and examination results - rather than teacher assessments - since before the pandemic in 2018-19.
All the figures make clear that at primary school level, Richmond out-performs most if not all local authority areas in England, which continues to make it a magnet for young couples.
However, high house prices and a falling birth rate in recent years means that several schools have had to cut back on the number of youngsters joining each September, which has led to budget and staff cuts.
The details of the stellar results were issued in a week when hundreds of the borough's teachers have been on strike in a bid to reverse a fall in living standards resulting from several years of below inflation pay rises.
Early Years Foundation Stage Profile
An assessment known as the Early Years Foundation Stage Profile, which looks at the progress of children up to the age of 5, found 74% of pupils in Richmond schools achieved a good level of development.
This was higher than the 65% national average and meant Richmond was ranked second of all 152 local authorities.
Phonics Screening Check
According to the Phonics Screening Check, which looks at how well children can decode and understand words, some 83% of Richmond pupils achieved the expected standard.
This put the borough's children at number one among all local authorities where the average was 75%.
Key Stage 1
Looking at total performance of youngsters after Key Stage 1, which is youngsters up to the age of seven, some 62% of pupils in Richmond achieved the expected standard or above in reading, writing and mathematics, compared to 54% nationally.
Some with 13% of this age group achieved greater depth in all three subjects, which was more than double the national figure of 6%.
There is no national ranking for these measures, however it is understood that Richmond was in the top five.
Multiplication Tables Check
A new on-screen Multiplication Tables Check assesses children in Year 4 using a test with a maximum score of 25. The average score for Richmond was 21.5, which was above the national average of 19.8 and the fifth highest in England.
Key Stage 2
Looking at children up to the age of 11, when they leave primary school, Richmond children achieved the best results in the country.
Some 76% of pupils in Richmond achieved the expected standard or above in reading, writing and mathematics, which compares favourably to the national average of 59%.
Progress scores for these children were well ahead of the rest of the country, particularly in mathematics.
Many of the borough's parents opt to take their children out of the state sector and send them to high performing private schools at Secondary level, although the cost of living crisis has led some to think twice.
Despite this switching, the Secondary school exam results at GCSE and A Level in the borough were strong compared to the rest of England.
Key Stage 4
Some 68% of pupils in Richmond achieved Grade 5 or above (including English and mathematics) in their GCSEs, which is well ahead of the national average of 50%.
At the same time, 39% achieved the English Baccalaureate, which is good grades in English language and literature, maths, the sciences, geography or history, and a language. This compares to 20% nationally.
The progress level for pupils at this stage was +0.4, which placed Richmond third of all 152 local authority areas.
Key Stage 5
The Average Point Score for A Levels in Richmond was 41.3 compared to 37.8 nationally. This placed the borough 10th of all 152 local authorities.
The average grade was B compared to B- nationally.
Richmond schools did less well in technical level qualifications, such as Btechs, with an average grade of Merit plus compared to national average of Distinction minus.
Details are due to be presented to the Education and Children's Services Committee on Monday, March 27.
CHECK OUT OUR Jobs Section HERE!
richmond vacancies updated hourly!
Click here to see more: richmond jobs
Share:


