Covid cases surge across Richmond but rate is fourth lowest in London
By The Editor 22nd Dec 2020


Richmond's coronavirus infection rate has hit a record high, fuelled by the faster spread of the new strain of the disease.
There were 696 confirmed cases identified in the borough in the seven days to December 16 - an infection rate of 351.5 cases per 100,000 residents.
Only the week before, up to December 9, there were 276 cases.
It is thought that the new variant of covid, which is 70% easier to catch, is accounting for 60% of cases in London.
While the virus is spreading throughout Richmond, other London boroughs have far higher infection rates.
Havering has 1,135 cases per 100,000 people. Richmond sits 29th out of 32 London boroughs.
All 23 neighbourhoods ranked
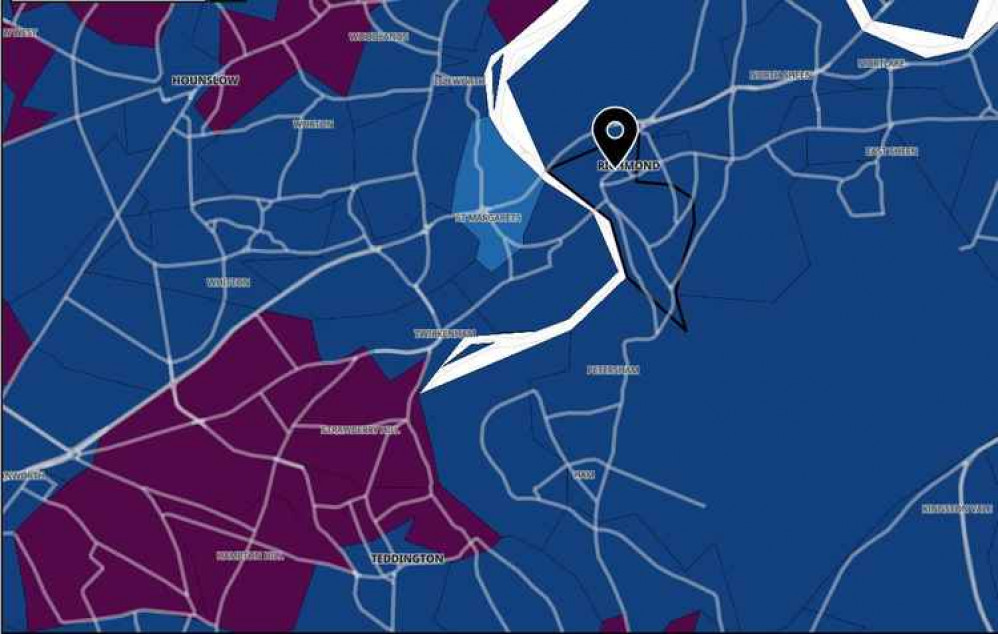
Covid-19 figures are plotted on an interactive heat map on the government website.
They are broken down by Middle layer Super Output Areas (MSOAs) - small areas with a population of around 7,200 people living in them. There are 23 of these in Richmond.
The map shows the infection rate for each area and the darker the colour on the map, the higher the rate.
We've looked at it and ranked each area in Richmond below.
Teddington North – 594.8 cases per 100,000 people (43 cases)
Strawberry Hill – 594.8 cases per 100,000 people (43 cases)Hampton Hill – 447.1 cases per 100,000 people (31 cases)
Twickenham West – 441.9 cases per 100,000 people (49 cases)Nursery Lands and Hampton North – 432.9 cases per 100,000 people (41 cases)
Heathfield – 398.5 cases per 100,000 people (43 cases)Hampton Village – 397.4 cases per 100,000 people (41 cases)
North Sheen – 391.8 cases per 100,000 people (48 cases)Twickenham Marble Hill – 381 cases per 100,000 people (28 cases)
Richmond Park, Sheen Gate and Petersham – 347.9 cases per 100,000 people (25 cases)Richmond Central – 340.9 cases per 100,000 people (25 cases)
Twickenham Town – 337.6 cases per 100,000 people (27 cases)
Hampton Wick and Teddington East – 332.4 (38 cases)Kew Gardens – 327.7 cases per 100,000 people (33 cases)
North Barnes – 316.2 cases per 100,000 people (32 cases)Teddington Central – 272.7 cases per 100,000 people (20 cases)
Twickenham North – 269.3 cases per 100,000 people (19 cases)Queen's Road – 256.6 cases per 100,000 people (17 cases)
Whitton – 251.8 cases per 100,000 people (21 cases)Mortlake and South Barnes – 241.3 cases per 100,000 people (28 cases)
St Margarets – 179.2 cases per 100,000 people (12 cases)Richmond Nub News on social media
You can find us on Facebook, Instagram, LinkedIn and Twitter.[.b]
CHECK OUT OUR Jobs Section HERE!
richmond vacancies updated hourly!
Click here to see more: richmond jobs
Share:


